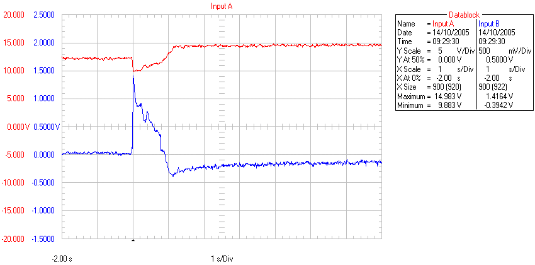
This image was captured as in the introduction section of the guide. As you can see this dual channel capture shows both the vehicle battery and the battery main ground condition during start-up and run. This was sampled by using both channels of a two channel scope, commonly grounding both channels at the battery negative post.
Channel A signal probe connected to battery positive.
Channel B signal probe at the engine block.
Channel A was set to a negative slope trigger at 10.2 volts.
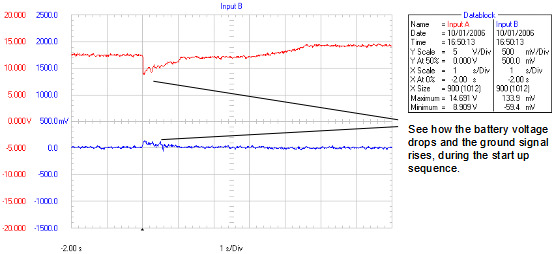
This represents a good sample, by most standards, but the following images will show a problem, which ultimately caused a vehicle operating fault.
The vehicle had been suffering from a stalling situation, shortly after starting and driving a short distance.
After completing the usual engine management system analysis, with no faults being recorded, I carried out the above test, followed by the following tests.
As I have said before, the results of the tests all by themselves would not alarm me, but with this specific vehicle fault, I had discovered this was a ‘tell’ to the problem.
If you look at the results of the, AC coupled, channel A, you will see quite a high value of AC ripple.
Both channels A and B were connected across the battery, with the engine idling.
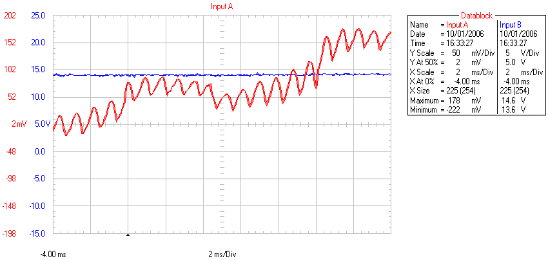
Channel A is AC coupled, Channel B DC coupled
Note: If you connect the scope probes to the alternator BAT+ post you will get a much higher AC ripple than at the battery, but as mentioned before, the BAT+ post is sometimes very hard to reach. Getting experience of sampling at easy locations helps to build your library of knowledge and in this case shows the battery’s ability to smooth the signal.
Also note that sometimes excessive AC ripple, may cause interference on sensitive circuits.
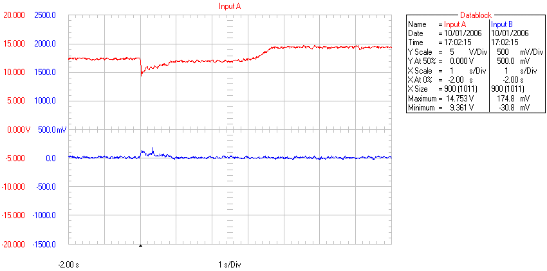
In the following images, you will see the results after a replacement battery was fitted. Note the voltage drop during cranking, is much less than previously, even though the start voltage was slightly less at approximately 12.4 volts.
This is the start test.
This is the AC coupling test.
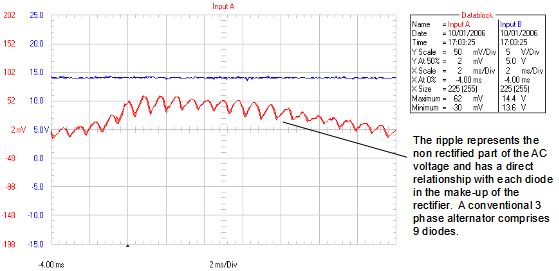
The AC ripple content is much less and ultimately these images represent a good battery and charging circuit. After the battery was replaced and the engine management re-initialised, the vehicle behaved perfectly. (This problem, later became a TSB where up-rated batteries were being fitted, to address this complaint).
The next couple of waveforms illustrate the battery and ground performance test, when the ground cable or connection have excessive resistance.
The first image’s ground fault was due to a bad connection on the gearbox and was easily rectified.
Both these captures were triggered by a negative slope set at 10.2 volts on channel A.
The fault with this ground voltage, was due to a bad cable. A replacement cable rectified the fault.
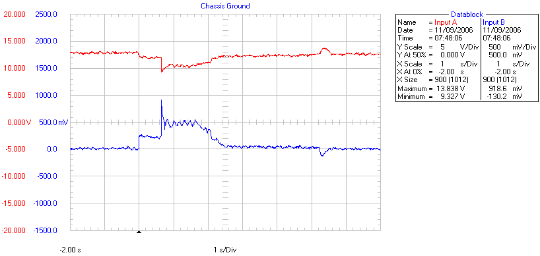
Interestingly in this image, you can see such a lot of detail of electrical loads switching on, like the glow plugs and the starter motor operation. Amazingly the ground volt drop remained under 1 volt during starter motor operation, but it reflects so much detail of the load applied. Presumably this is a characteristic of the build up of resistance in the cable, as opposed to a bad connection.
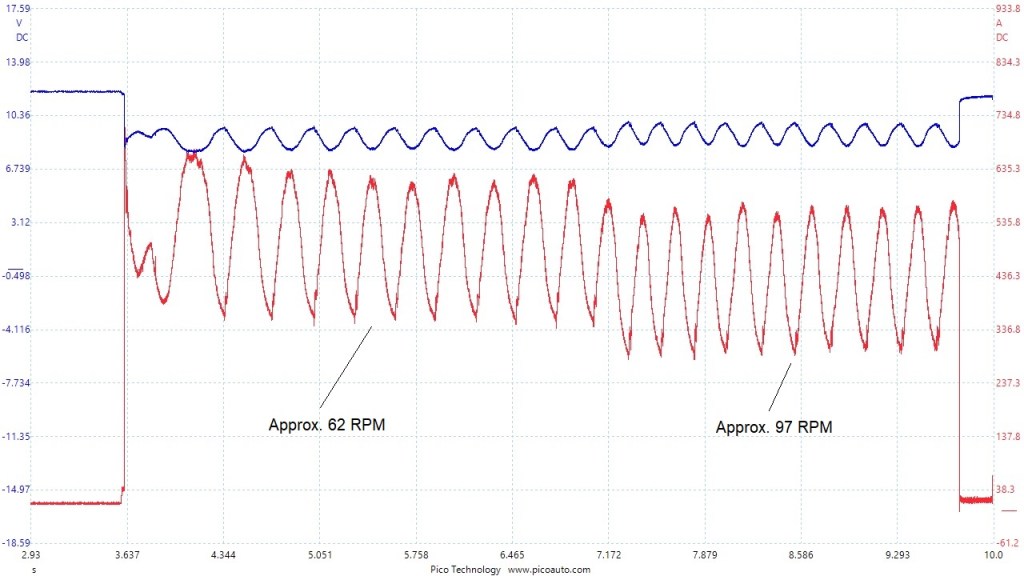
This image shows a start and charge capture, in a basic form.

Green channel connected across the battery.
Brown channel current clamp connected over battery negative cable. (0 to 200 amp clamp, used for greater resolution in the charging pattern).
This brings us on to another useful analysis, from this set-up.
Starter motor performance. This test not only gives us an indication of starter motor performance, but also one of the most useful tests you will ever do; relative compression.
This example is taken from a 2.0 litre petrol engine, with no faults and approximately 80,000 miles on the clock.
This test shows the starter motor current, with the engine disabled from starting. I have used a high current amp clamp connected to the battery negative cable.
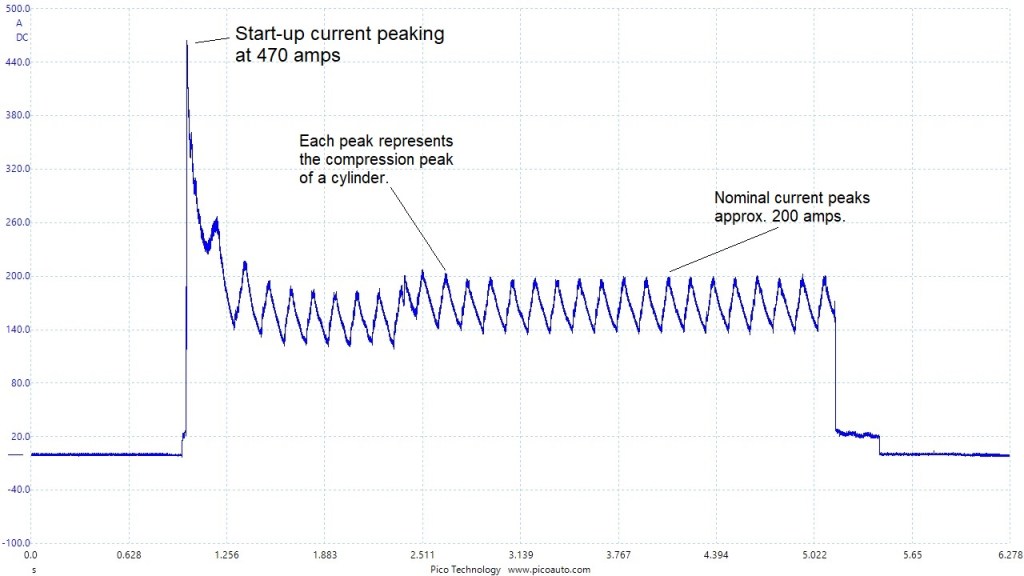
Using this test, you can determine the cranking speed (RPM), by using a simple calculation after measuring some time markers. Together with the speed and amperage, you can identify starter motor and engine integrity. If you’re using a Picoscope, then you don’t even need to do the calculation, it’s available in the software.
We’ll take a closer look at the above waveform, to show the details of what you can see.
Bare in mind, the sample engine is a 4 cylinder petrol. Nothing special or unusual and so makes a good subject.
This is a closer look at the nominal run of compression strokes. It’s important to crank the engine long enough to get a stable reading.
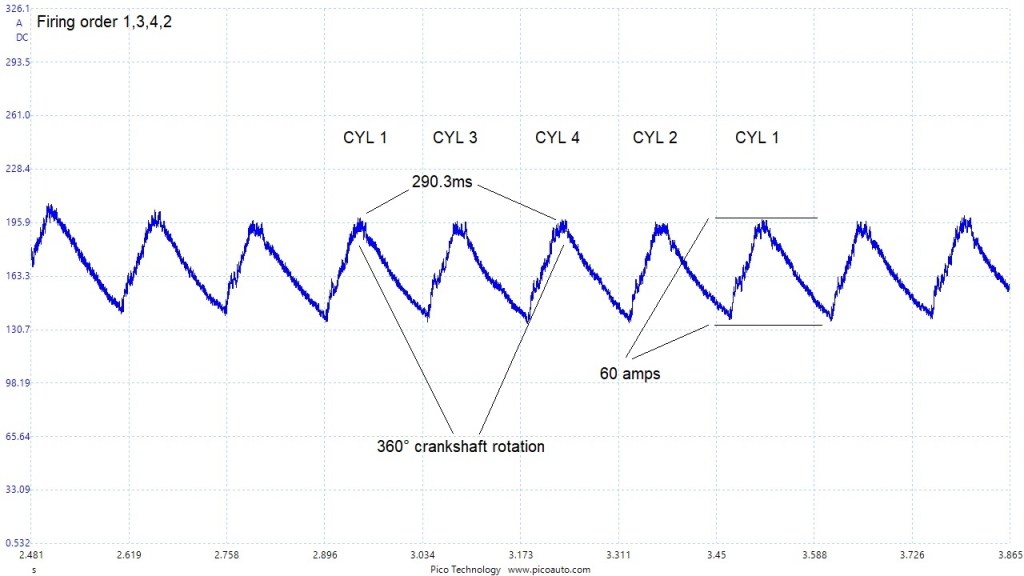
Each peak represents a compression stroke in firing order. So very quickly you can see if there is a compression issue, which may require further investigation.
If you measure the time between the two peaks of the 360º markers and then divide that figure into 1 minute, you will get the RPM: 60,000ms divided by 290.3ms = 206.7 RPM.
As with many of these waveform samples, comparison is the key. However I generally find the current between the high and the low peaks is approximately 60 to 100 amps, depending on the engine type, for a good working engine and starter motor.
This illustrates a good sample, but what does a bad sample look like?
We’ll have a look at a couple of different failures next.
This image is from a diesel vehicle. It is a 1.4litre 4 cylinder direct injection common rail engine.
As you can see, there is a very obvious problem with this relative compression. This vehicle had a very lumpy idle when cold and you can see that 2 cylinders had low compression.
The next problem is; which 2 cylinders? Even with the injectors disabled on this, in order to carry out the test, by using a dummy injector and a second channel with an amp clamp connected, we can set a reference trigger. That way knowing the firing order, allows us to know which cylinders have the problem.
Diesel engine relative compression with cylinder reference.
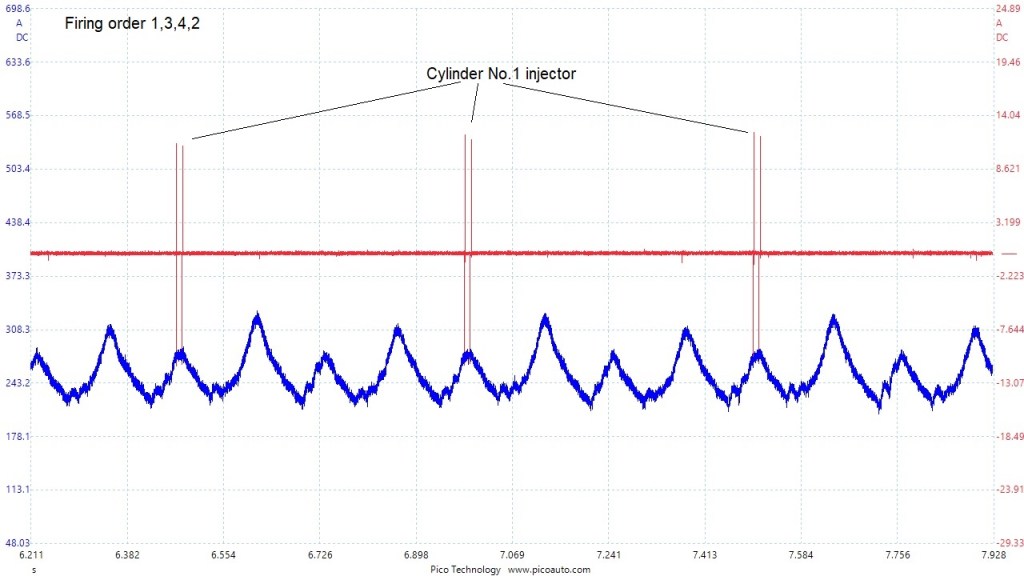
From this waveform, we can see the injector current during a firing event, indicating cylinder number 1 position. Now we can see that both cylinder 1 and 4 are bad.
This was a fairly low level misfiring condition, only present during cold start and warm up. In fact this was caused by the injectors leaking combustion gas past their seal.
Blue channel: High amp current clamp around the battery negative cable.
Red channel: Low amp current clamp connected to a dummy injector, I always carry with me. You can use a load resistor for the same effect.
Time base – 2 secs/div or 20 seconds screen sweep.
With this test, on both petrol and diesel, you can also see the ignition/injection timing position relative to TDC. Yet another useful diagnostic check.
This test only takes minutes to complete, which is a significant improvement over a physical compression test.
As you can clearly see; how distinctive a minor compression loss is on the starter motor current, imagine how easy to spot a significant compression loss would be.
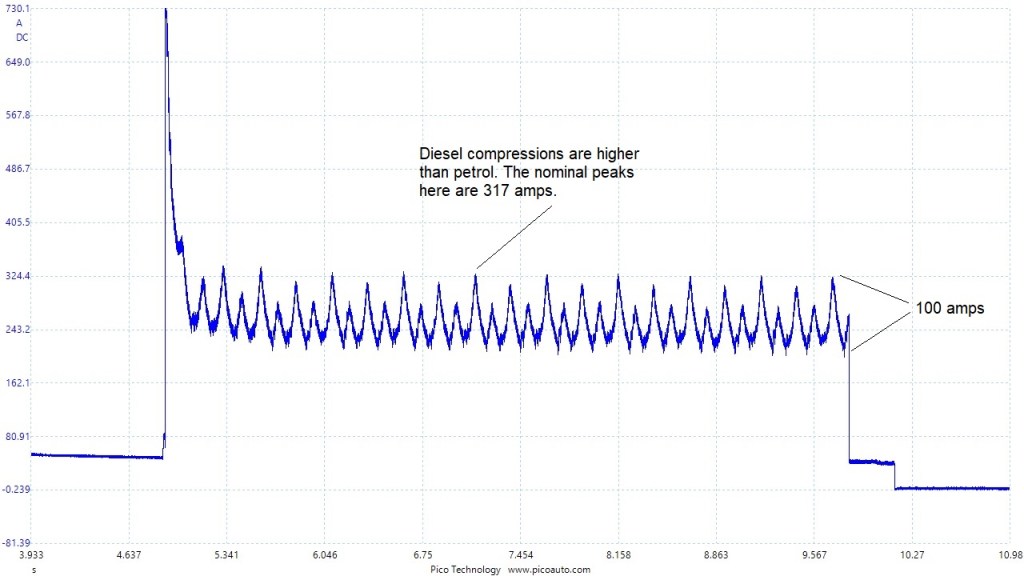
Now we’ll have a look at a bad starter motor. This one is taken from a diesel turbo 3.0Litre V6 engine, suffering from a significant poor starting issue.
You can see the start up current drops very slightly into it’s nominal value of approximately 630 amps, until it suddenly drops slightly to about 570 amps and picks up speed.
With a fault like this, you do need to eliminate engine seizure either by internal engine faults or ancillary drive units. However in this case, once the engine started, everything was fine. A new starter motor was the cure.
Blue channel: Voltage across the battery
Red channel: High amp clamp over battery negative cable.
Time base – 1 sec/div or 10 seconds screen sweep.
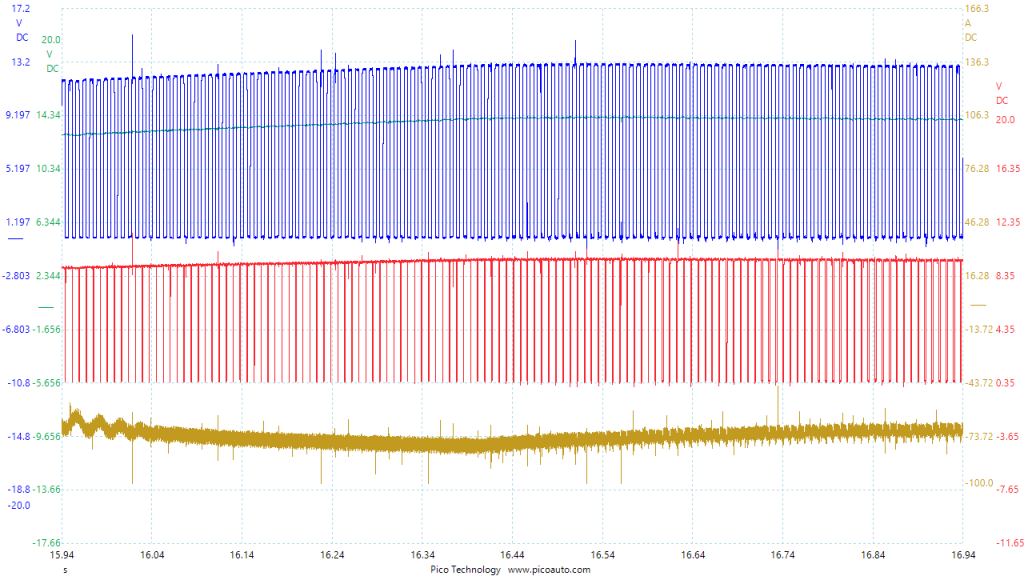
The next set of images are taken from a Ford smart charge system. Don’t worry about the congestion of the scope traces, I’ll expand the views in the following images.
This capture was taken using a 4 channel Picoscope with a 2 sec/div setup. Unlike some of the previous images, which were captured with my Fluke 199, the Pico has such a large memory buffer, I can zoom in on this waveform and not lose any detail.
In this capture:
Blue is the command signal from the PCM to the alternator.
Red channel is the monitor signal from the alternator to the PCM.
Green channel is the battery voltage.
Brown channel is the battery amperage. (Using a high amp current clamp, connected over the battery negative cable.)
Time base – 2 secs/div or 20 seconds screen sweep.
The screen shows start, run and charge.
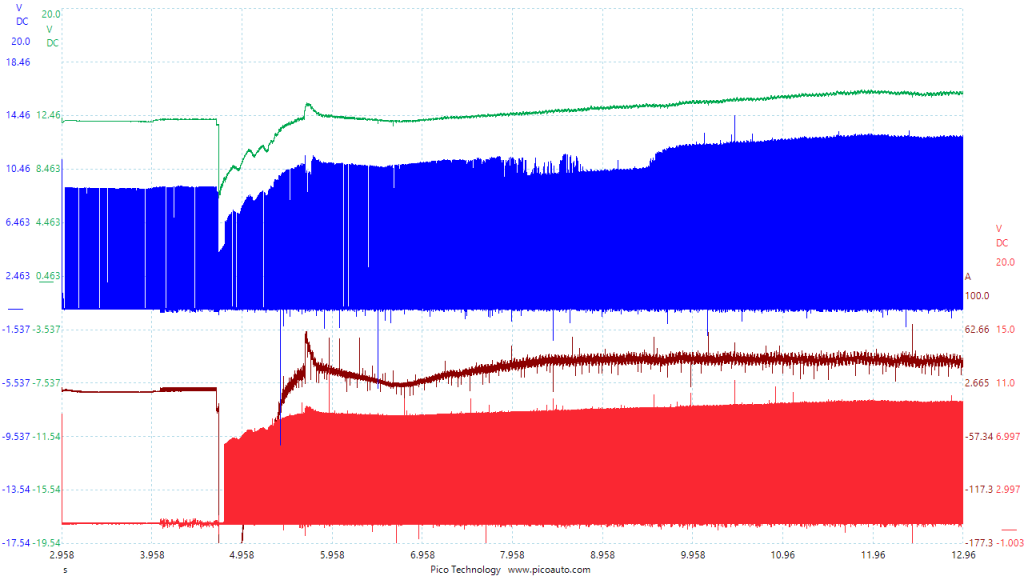
The blue and red channels are a mass of colour, because of the long time base. They are in fact square wave patterns, illustrating the command and monitor signals for the smart charge system. It is done simply by controlling a duty cycle from the PCM (Power Control Module), to the alternator and the alternator replying with a duty cycle. The two signals should never match.
You can see how useful the current clamp is, as you can now see the charging current as well as the voltage rising.
We will see some better details later in the reference section.
In this next image, I have zoomed in several times to show the details of the command and monitoring signals.
Now you can start to see detail of the square waveforms and the slight change in their duty cycle, as the battery voltage and current changes.
This is another, closer look.
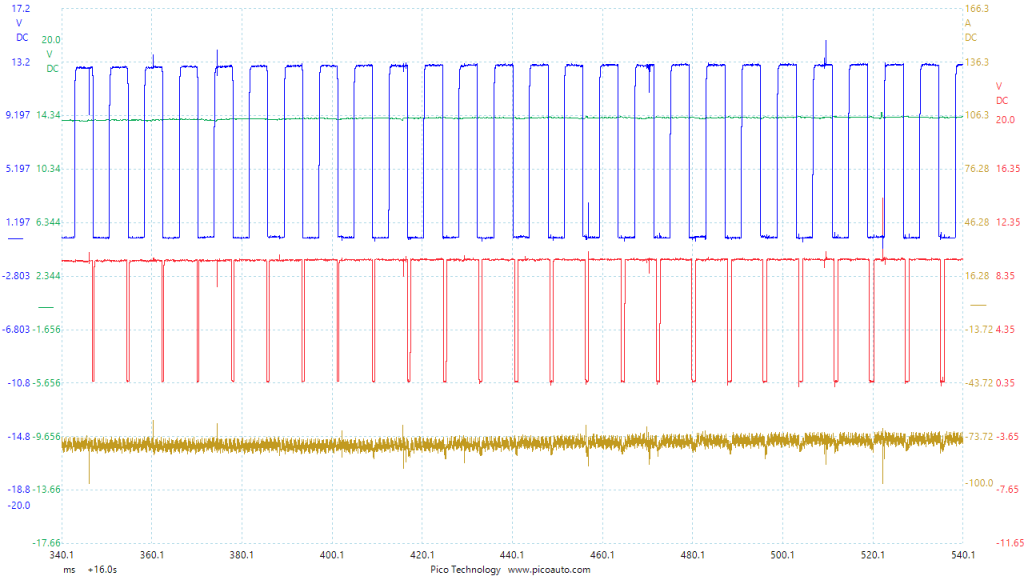
You’ll notice the monitor really starts to change, compared with the command.
This last image is a zoom shot of the signals just after starting, and so the alternator needs to charge the battery. You can see how the PCM command line is dramatically different to the monitoring line, with a much lower duty cycle, than in the previous image.
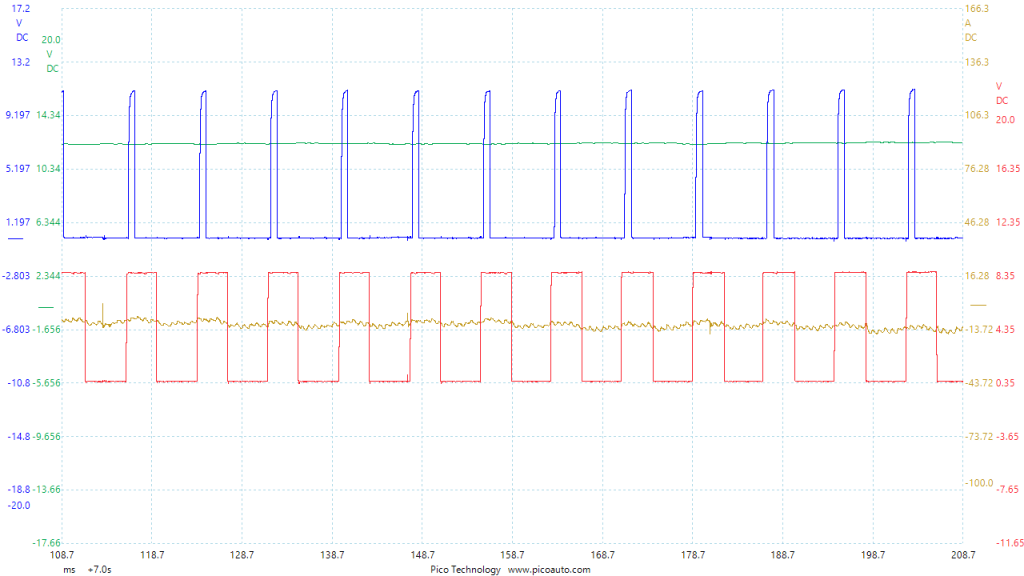
The scope allows us to see fantastic details about the components we have to test, but remember to research the systems you are testing, because until you know how something works, can you really determine failure?
The following images come from a 2010 M59 Peugeot Partner 1.4L KFW.
I have taken the opportunity to really drill into this system, although it is not complex at all.
It is not a smart charge system. It is a self regulating alternator, which informs the engine ECM of it’s charge status via a duty cycle signal.
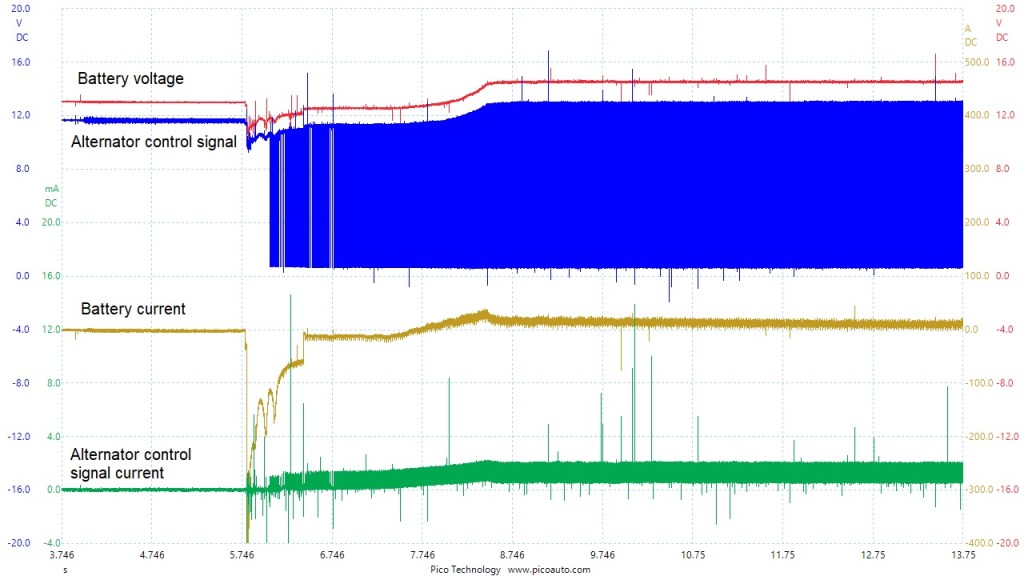
The image above shows a start sequence, illustrated by the voltage and battery current drop, followed by charging voltage and current.
Channel Blue: Alternator control signal. +-20 volts range
Channel Red: Battery voltage. +-20 volt range
Channel Green: Alternator control current +-20mA range
Channel Brown: Battery current. +-500 amps range
Time base: 2 seconds/div or 20 seconds screen sweep
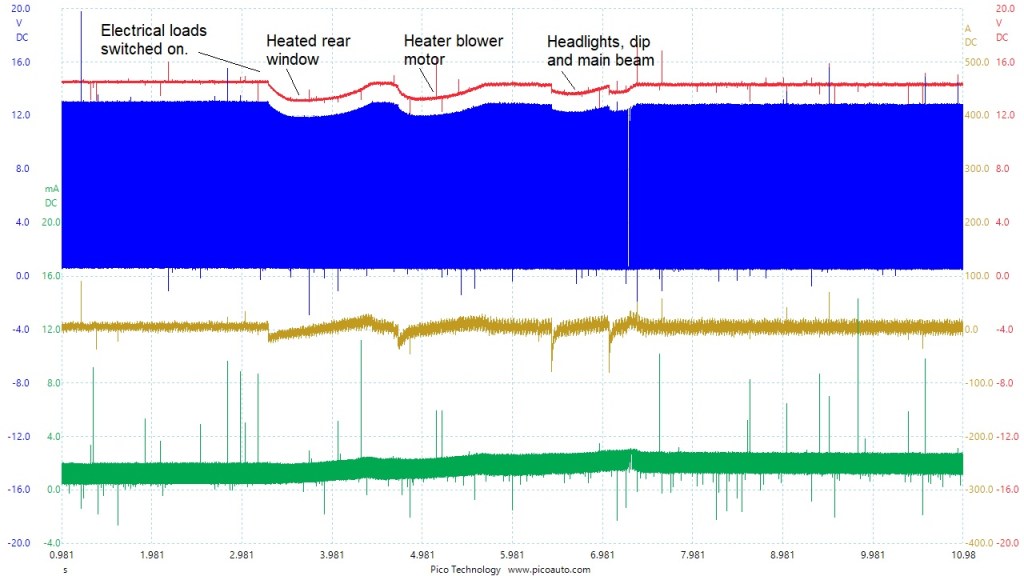
You can see in the image above, the reaction to voltage and current when electrical loads are switched on.

The image above shows a zoom in on the details of the current change. It shows the subtle difference in alternator control duty cycle.
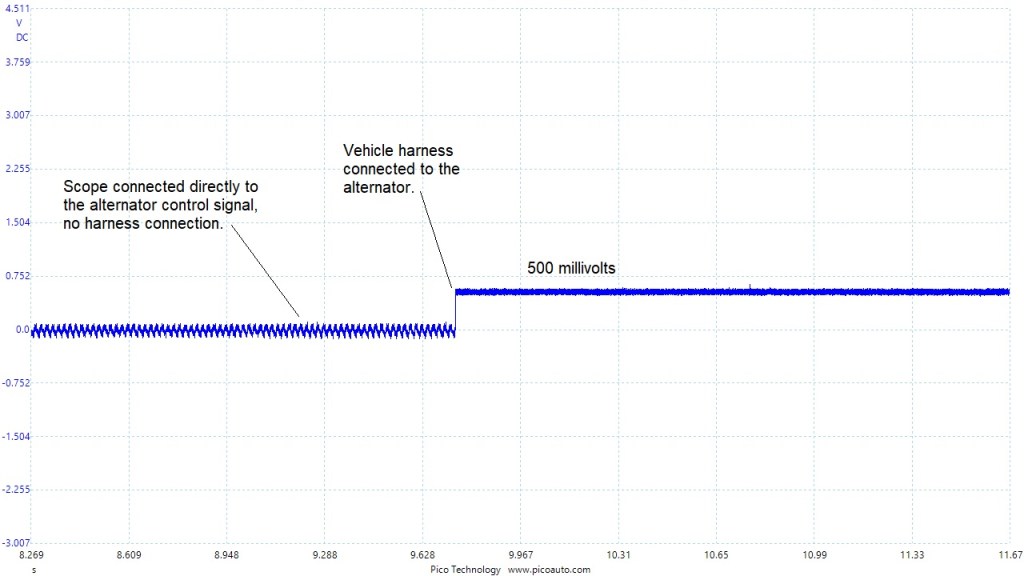
I have shown the images above and below, to illustrate the circuit for the control signal. This is useful for diagnostic purposes.
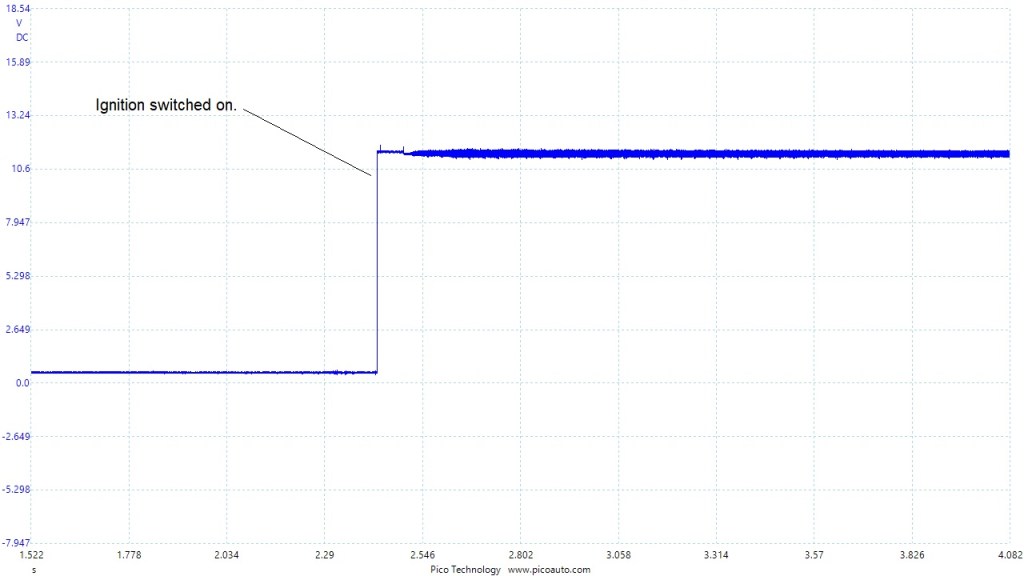
The image above, shows the control circuit further on from above, as the ignition is switched on. This action raises the voltage from 500mV to 11.5V, although still dormant. As seen in the first image, the alternator is responsible for controlling the duty cycle, to inform the ECM of the load. The ECM can then make the relevant modifications to control torque etc. I have referred to the alternator control signal throughout the set, in-fact a more accurate term would be monitor.
I have included this set of images, as I always find that manufacturers rarely give you the practical information regarding system analysis and trouble shooting. Usually they just say things like ” check continuity between alternator and ECM, and if good replace one or the other”. Not helpful!
