The following set of images are from a 2018 Peugeot Partner 1.2l turbo EB2 engine.
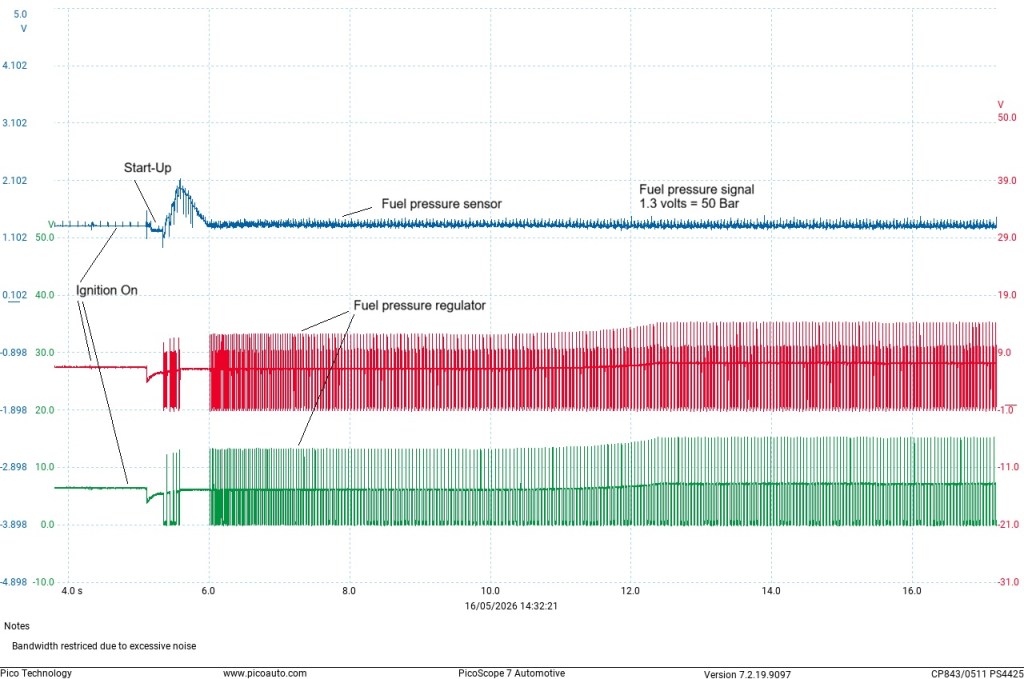
The 1st images are of the high fuel pressure control system, as this is a GDi system. Not shown here, its pre-supply fuel pressure is approximately 4~5 Bar.
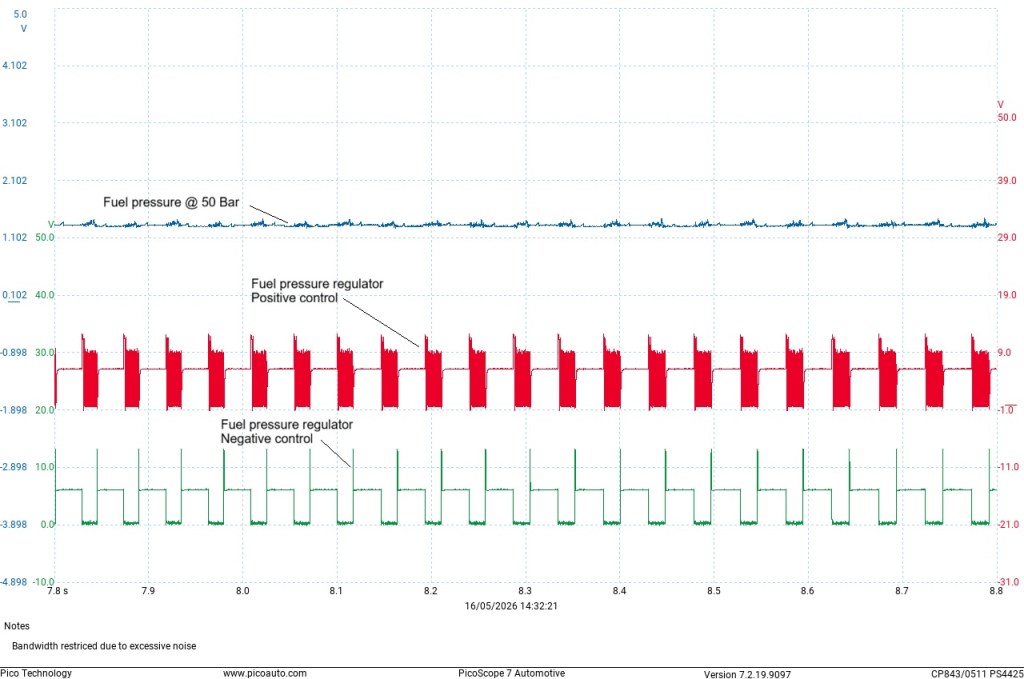
The next image shows a zoom in of the above.
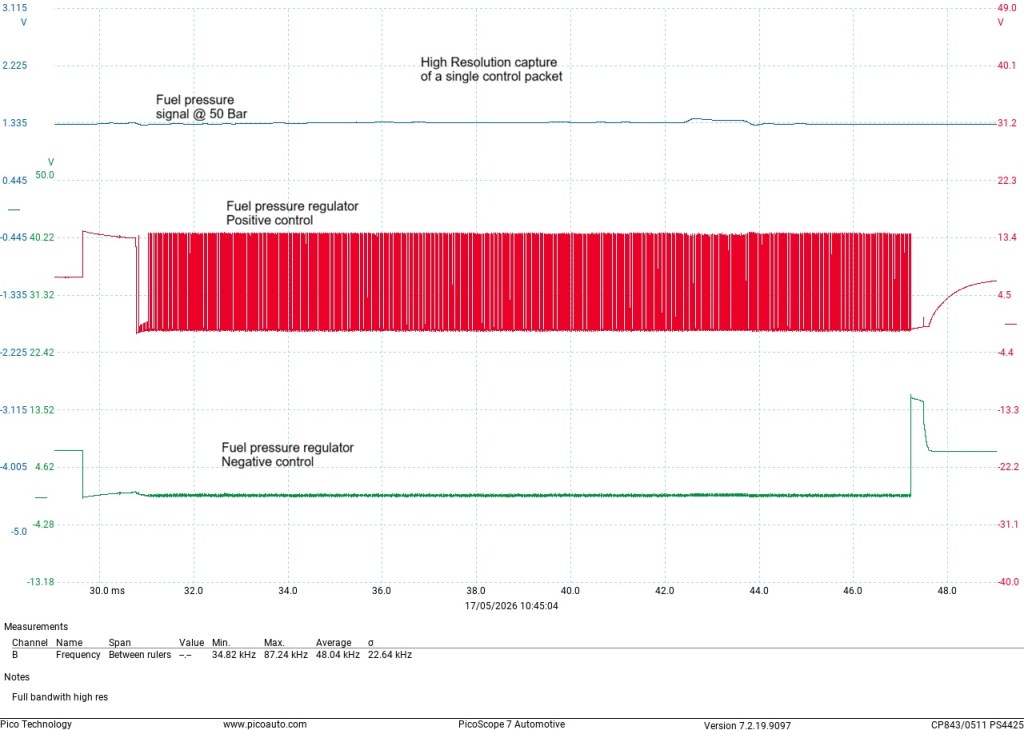
The following image shows a single control packet.
There is some filtering of the signal for display clarity.
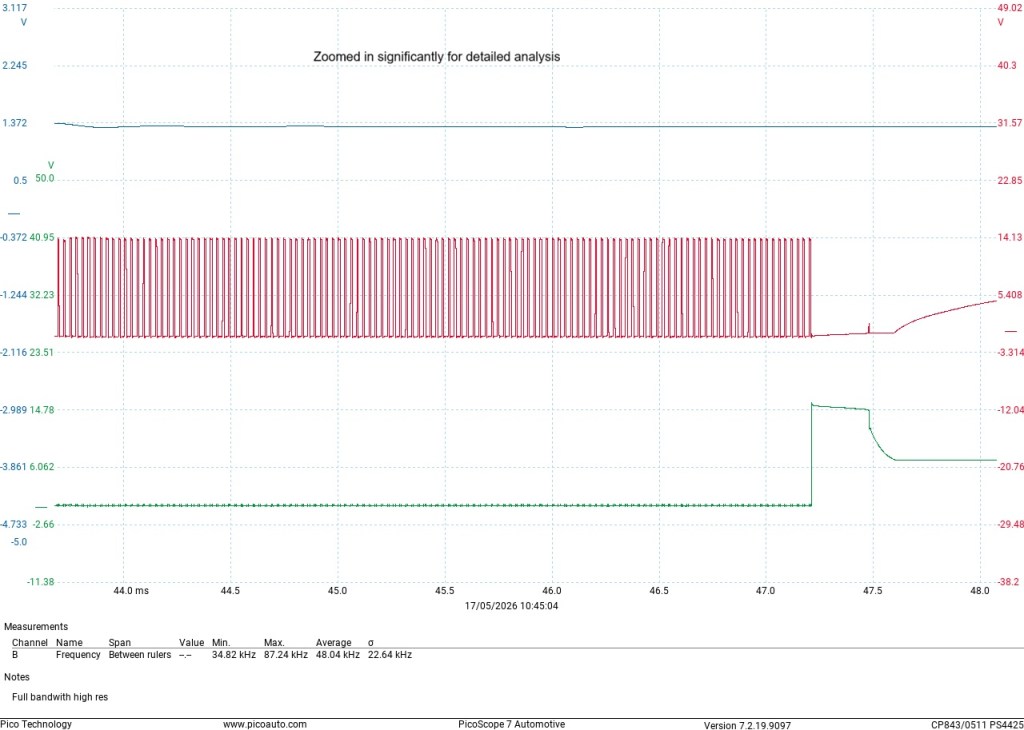
This last image in the series is a zoomed view of the above. Again it has some filtering present, for display clarity.
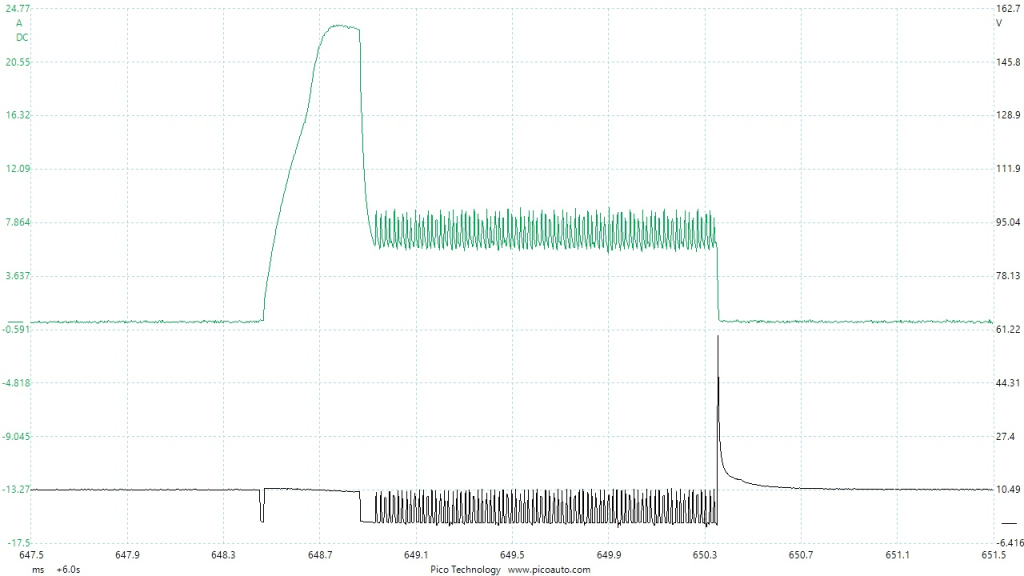
This image shows a failed injector. It has a short circuit, causing a cylinder misfire. Using the current clamp in conjunction with the voltage, really illustrates the fault.
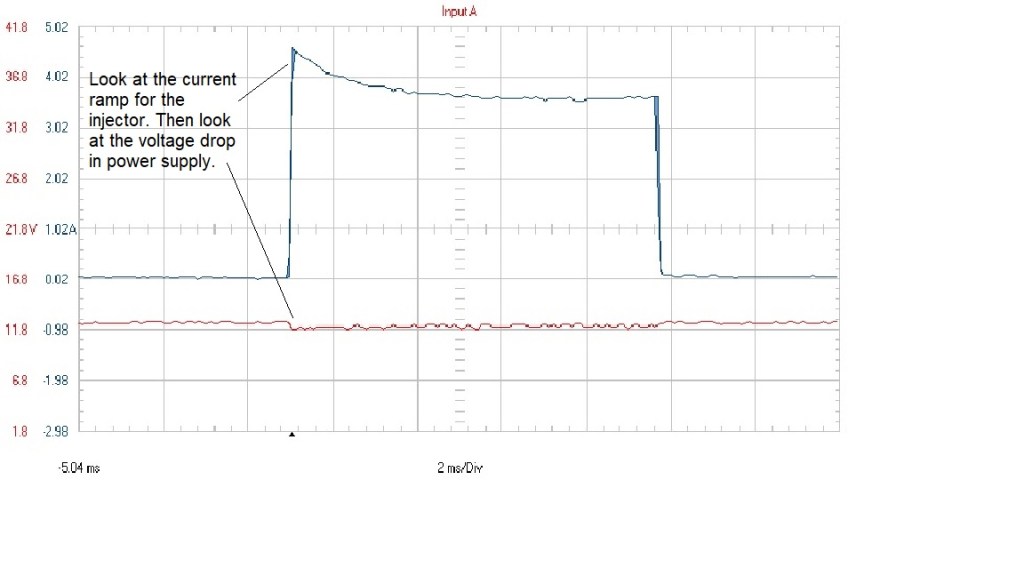
(It is regrettable that I didn’t sample the control side of the injector during this capture).
To follow that image, here is the opposite petrol injector failure.
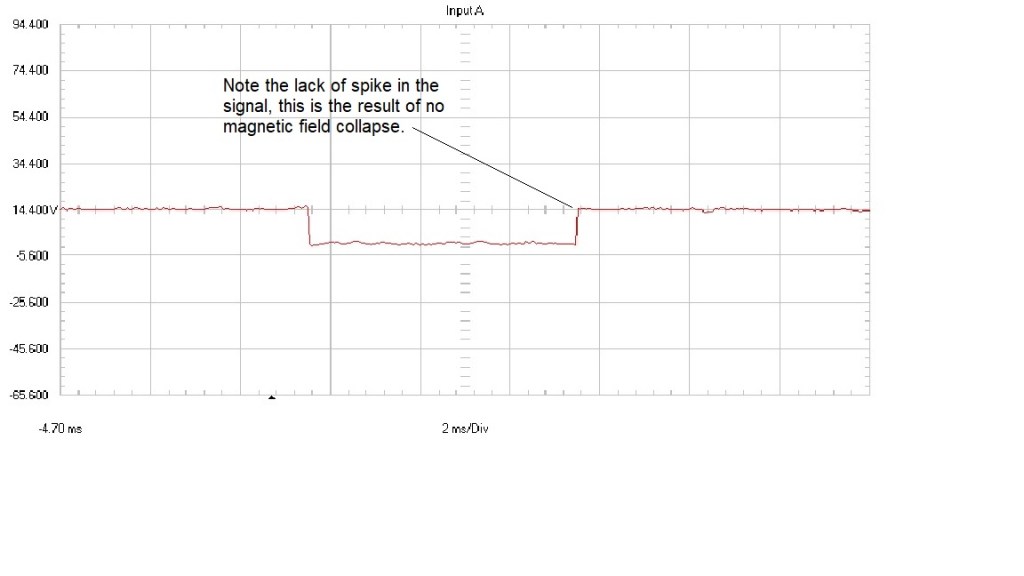
As you can see in the image above, the electrical circuit was intact, but the injector solenoid was not opening. It was a shame I didn’t capture the current signal. However this fault was high resistance in the solenoid, not open circuit, therefore making it ineffectual.
I would just like to show this next set of captures, because I nearly missed this diagnosis, mostly due to the inaccessibility of the petrol injectors. It was only when I found a good access point in the harness, that I was able to get to the problem.
The vehicle was a mid nineties 3.5 litre petrol V6, which was running very rich. On first inspection, It did have a problem with the oxygen sensor, which had took a while to get right. But sadly it didn’t cure the rich condition.
Take a look at this first image. This was not the first capture of the injectors I took, as originally I only sampled voltage from one partially accessible injector and didn’t notice the problem.

As you can see in the above image, there is a ‘standout’ problem. But which is the problem?
Please note; that if I had made this capture first of all, I would have reduced my diagnosis time.
‘Hindsight’ is a wonderful thing!
Let’s take a closer look.
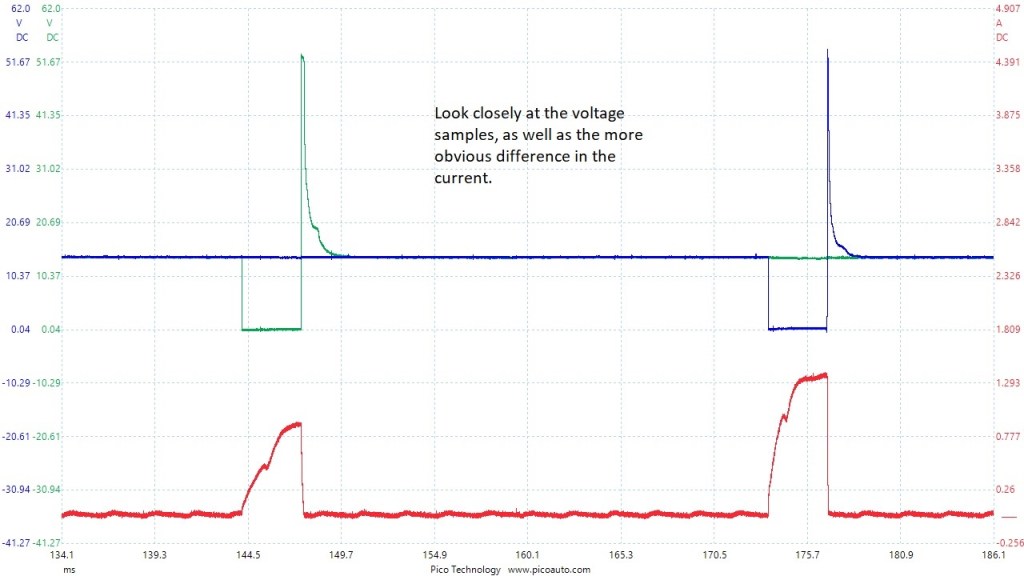
Now we can see a little more of the problem. If you refer back to the sample of a good ‘saturated coil’ injector, you may determine which one is bad.
In this case, as we saw in the first image, we have 5 injectors with the same current profile. But if you look closely at the voltage signal, you may notice the differing ‘pintle hump’ signatures. Again, these were the same on all 5 injectors with the higher current ramps.
Now we’ll look at the high current injector in detail.
All by itself, you would be forgiven for not noticing the minor discrepancy in, both the current ramp, which doesn’t look quite right, but more importantly, the voltage signal ‘pintle hump’.
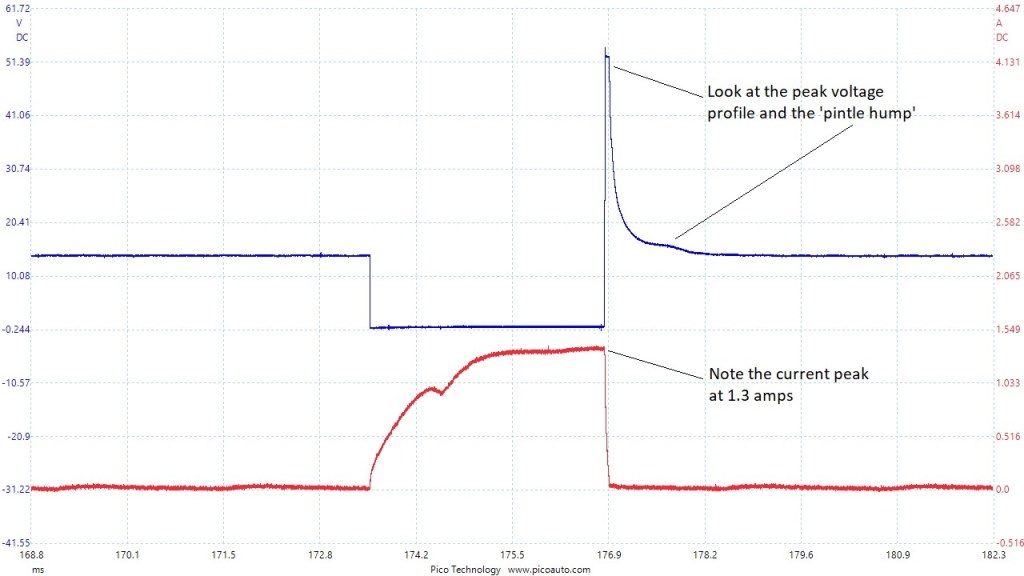
So let’s look at the ‘standout’ other injector image.
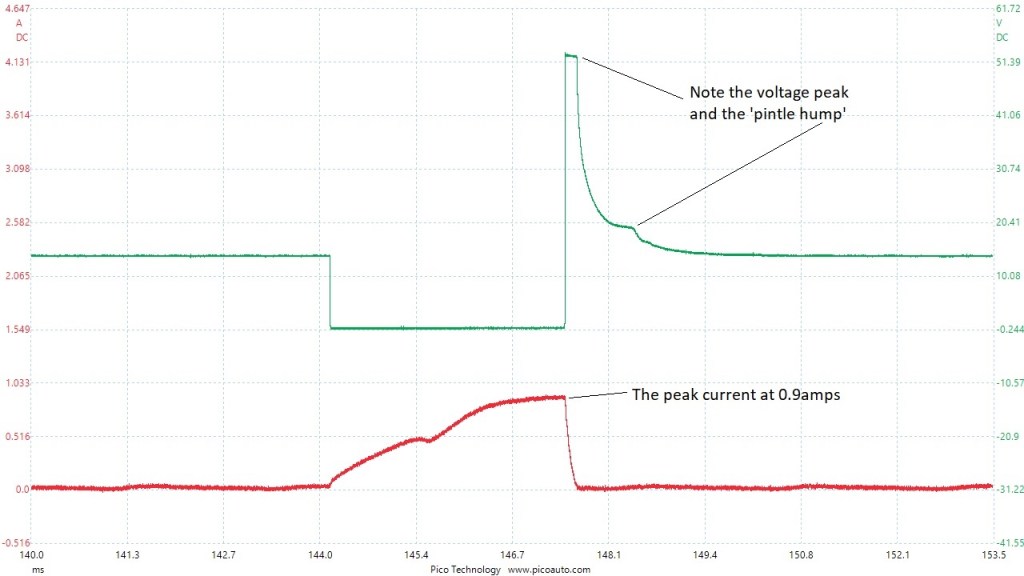
The current ramp, instantly looks like a normal ‘saturated coil’ injector, with the more usual 0.9 amp peak. I say more normal, as this is more normal for a mid nineties injection system. The sample I gave earlier peaks at 1.1 amp and is normal and that’s why I never like to give facts and figures.
Comparison was the give away in this case, but if you look closely at the ‘pintle hump’, you see how the pintle has snapped shut, giving a relatively sharp step, in comparison to the high current ‘pintle hump’, where the pintle gently shuts off. This is the indicator of the injector not closing very well, causing a rich condition.
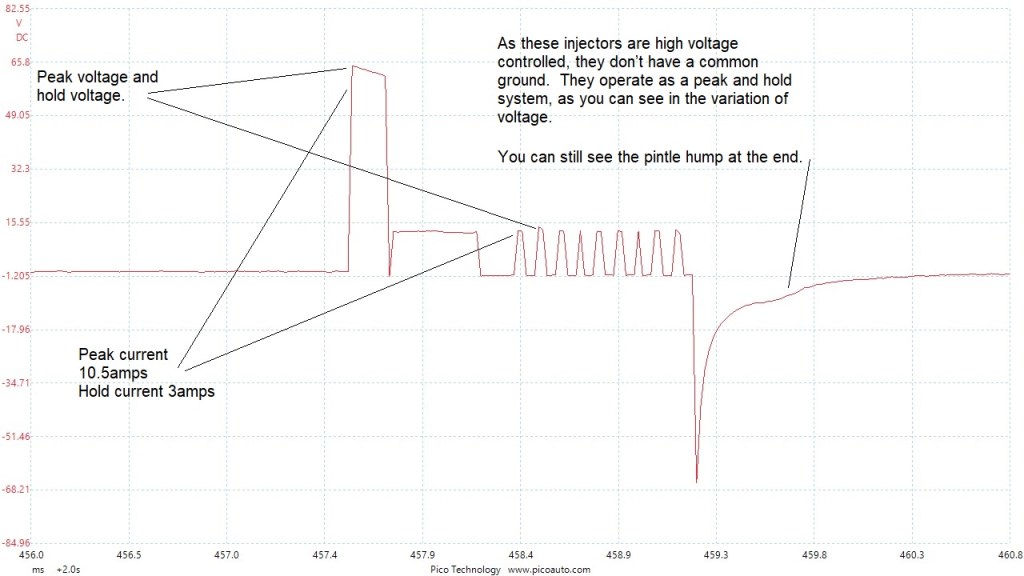
Now we’ll see an image for a direct injection, petrol injector (FSI, GDI, HPI etc.). This signal was captured using a differential coupling and owing to access difficulties I have not been able to capture a current signal, but I have seen one and it peaks at about 10.5 amps and holds at about 3 amps. This is a solenoid actuator. You will see the similarities in the following signals to those of the direct injection common rail diesel, later in the section.
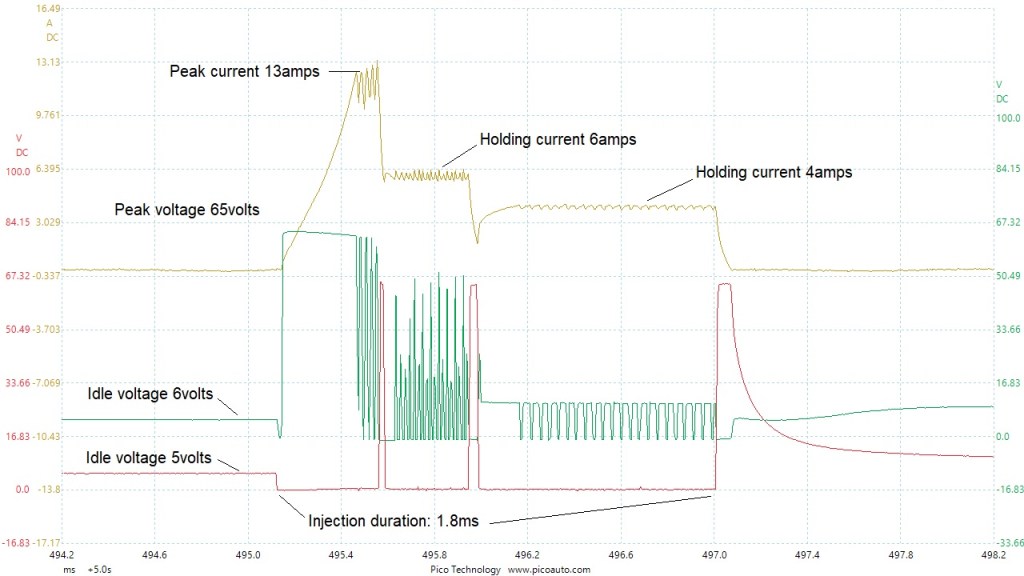
The following images, update the above image from the total capture point of view.
This came from a 2016 Vauxhall 1.4 litre turbo direct injection engine. This engine is much more friendly for capturing samples.
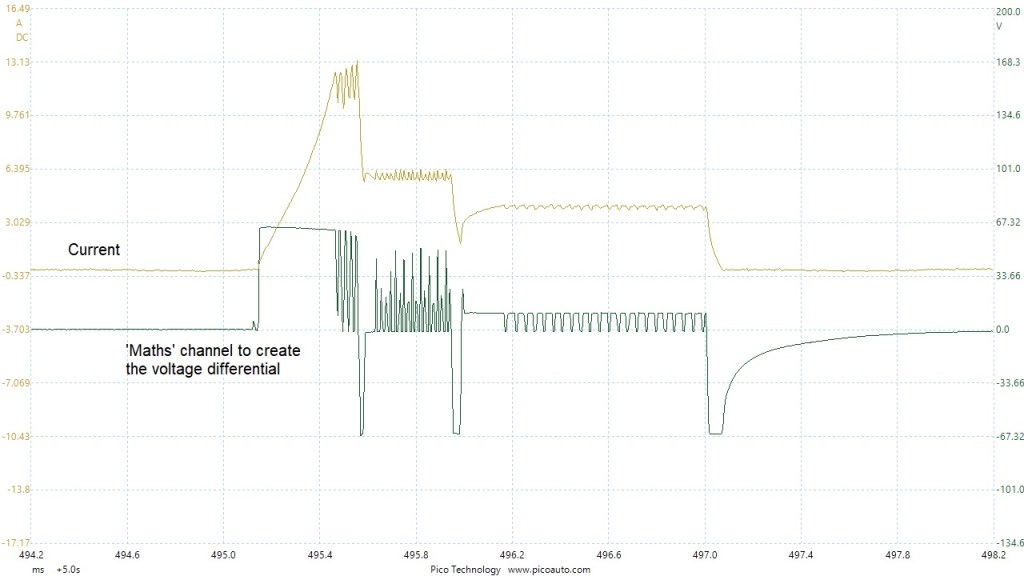
A cleaner view of the voltage signal by way of the ‘maths’ channel.
This next set of images show a Piezo direct injection injector. Again there is no current signal, as access was difficult. This one, however, is captured with a common ground coupling, sampling both channels. The 1st image is a sample of multiple signal events.
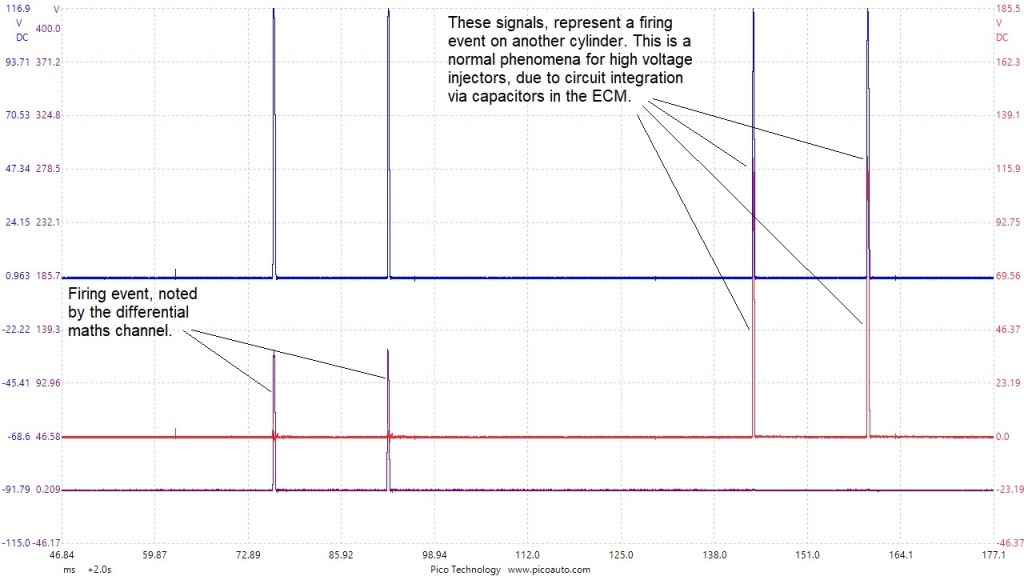
This next view, is a close up of a firing event.
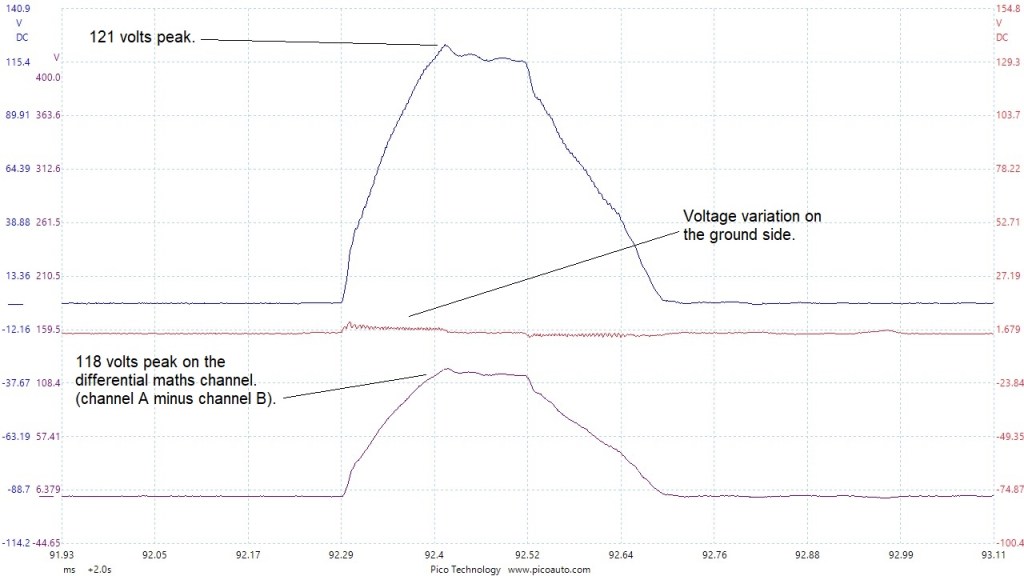
The second to last in the set, is focusing on the ground, which actually represents the current waveform. I’ve included this as it does show how volt drop illustrates current flow.
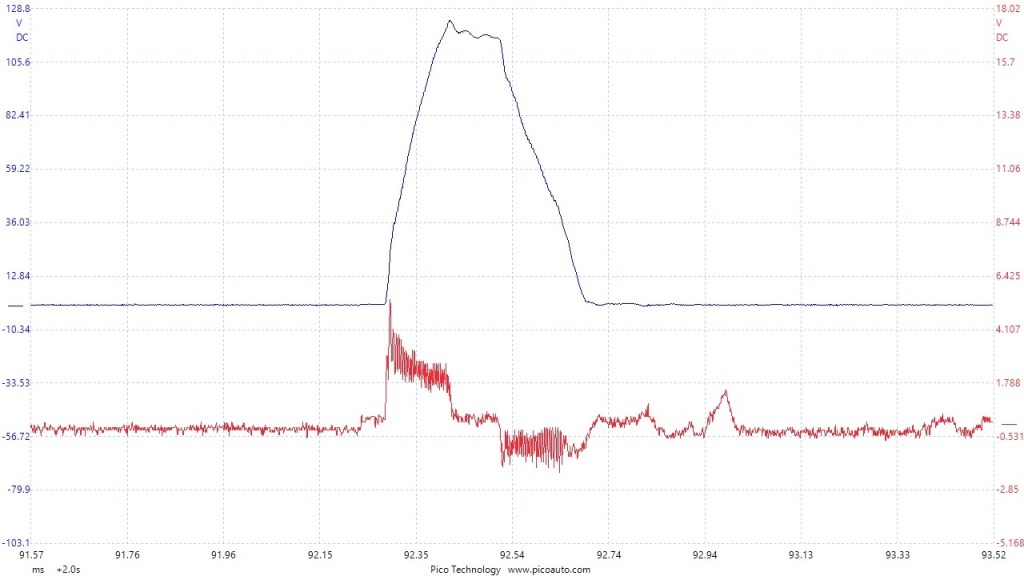
This final image of a Piezo petrol direct injection injector, shows both voltage and current. It demonstrates how accurate the ground voltage drop is for displaying the ‘work’ signature.
It is of the same type of injector as previous.
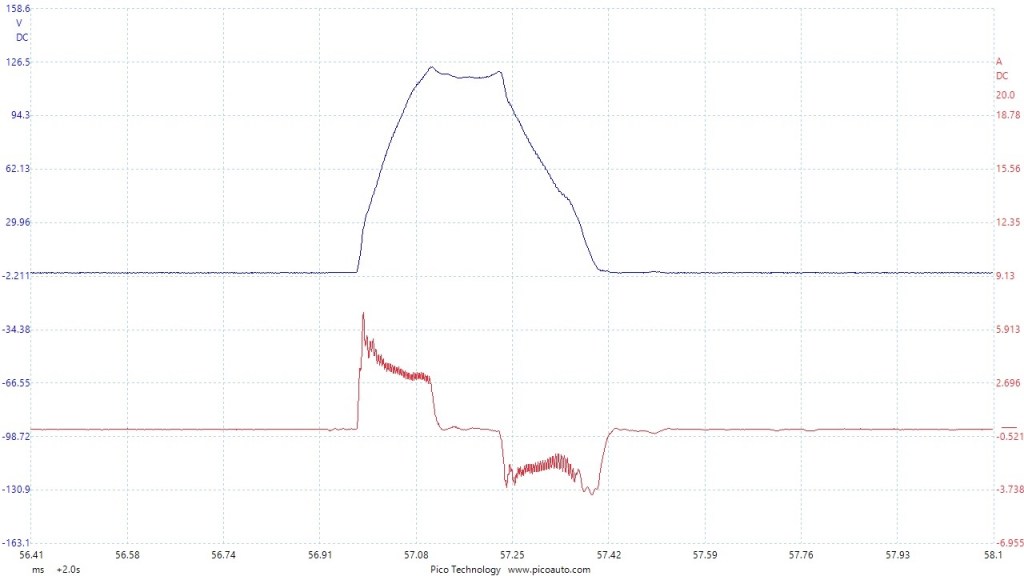
Blue trace – Voltage signal from Injector, using a common grounding. Scaled for 200 volts
Red trace – Current signal using low current clamp on one side of injector. Scaled for 20 amps
Time base 500ms/div or 5 seconds screen sweep. (Non triggered or free run).
The following set of patterns are all taken from ‘common rail’ diesel systems. So these are all direct injection injectors, both solenoid and piezo actuators.
This first image illustrates a Bosch solenoid diesel injection cycle. It comprises a pilot injection, followed by a main injection. This system is an early EDC15C and only uses a single pilot injection, which will switch off above a certain RPM range.
In this capture, as with the direct injection petrol injector, you can see multiple events. This is why I try to use current sampling on these systems. It’s much easier to trigger and identify a firing event. The low current event is used on this system to assist in the capacitor charging, required to provide the high voltage. It does not actuate the solenoid.
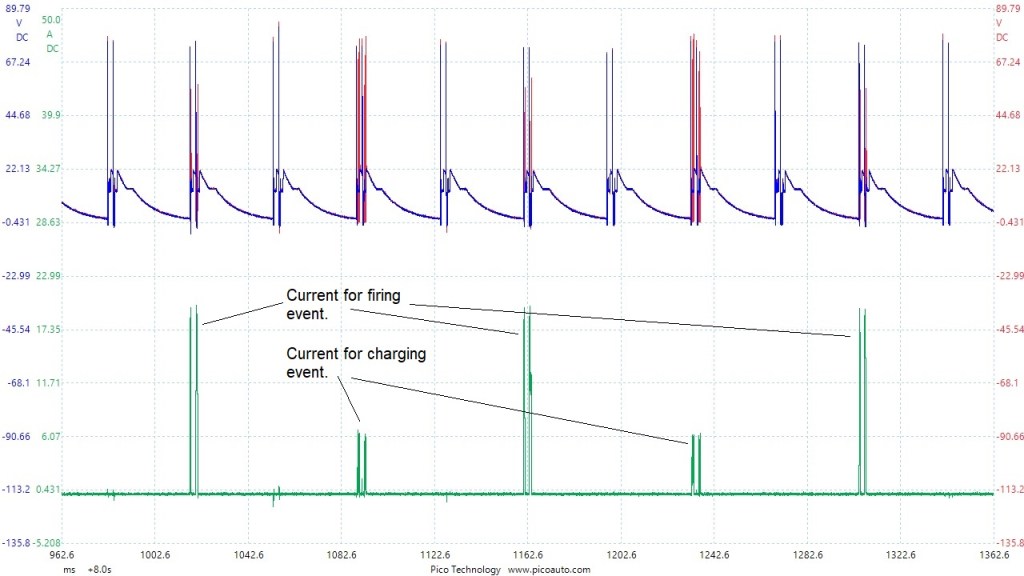
In this system, there are two capacitors internal to the ECM, which are used to store the high voltage required to operate the injectors. In the case of these Bosch solenoid injectors, they operate at around 50 to 80 volts.
I have captured this sample, using channels A and B as voltage direct to each side of the injector solenoid, with a common ground connection, both with a voltage range of 200 volts, and channel C, using a low current clamp fitted to one side of the injector. +-50 amps range.
Time base 2sec/div or 20 seconds screen sweep.
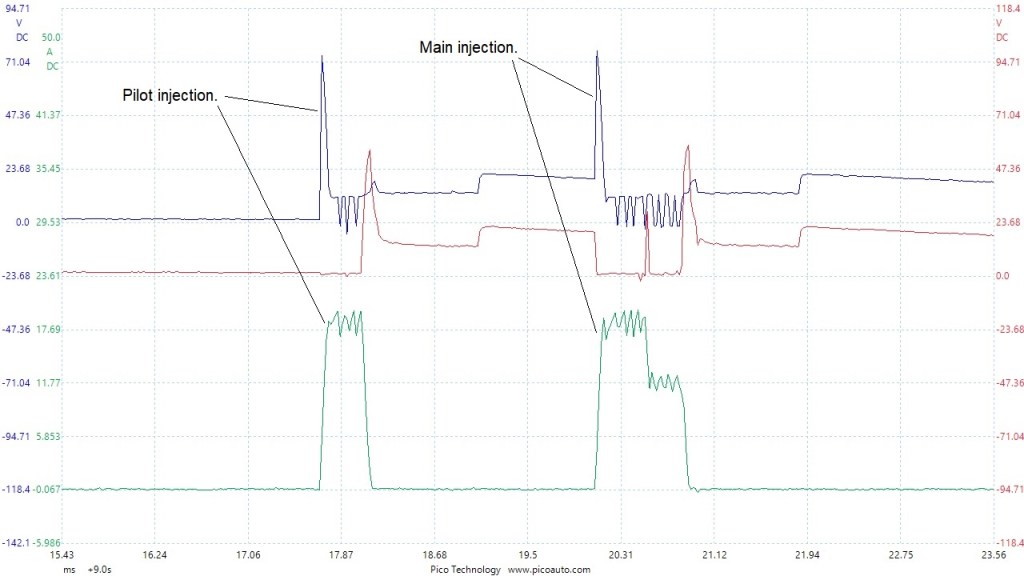
This image shows a firing event only in some detail. You can see the detail of the voltage samples and the current signal really shows the event.
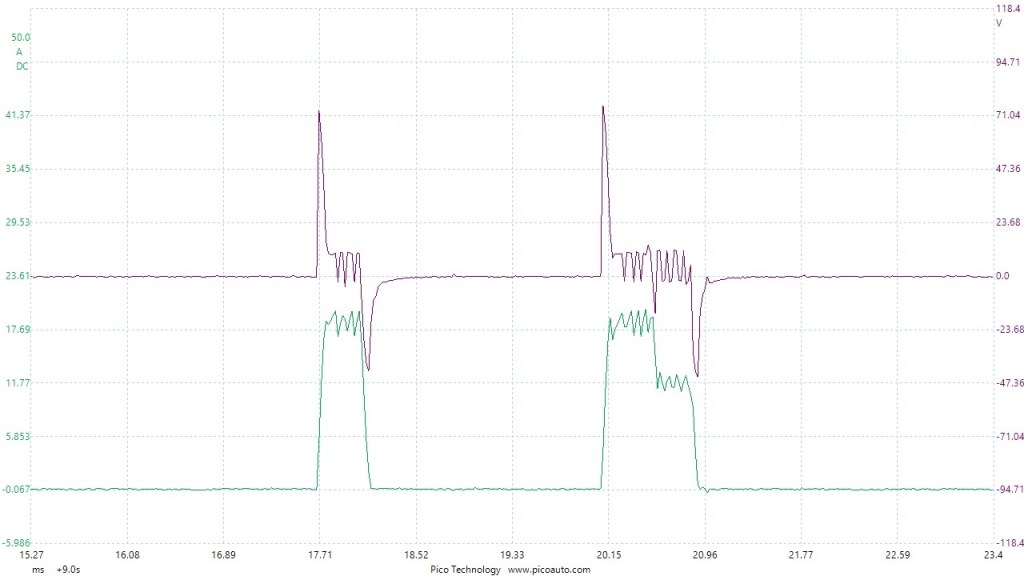
This next image has used the scope’s maths channel, to clean up the injection voltage sample. The same result can be achieved by connecting the scope across the injector, but this would be a problem if your scope does not have isolated inputs and you are sampling multiple inputs.
The following injectors are solenoid injectors, however they are controlled by battery voltage, instead of the more common high voltage.
These are made by Delphi and are unique in their design. They are also very widely used.
The injectors shown here are part of the commonly used system and in addition to injecting fuel into the engine, they are also used to reduce rail pressure.
This capture used a scope set up as follows:
Channel B: DC +-100 volts
Channel D: DC +-100 volts
Common ground at battery negative.
Although they are 12 volt operated, they don’t switch on in the same way as a conventional petrol injector. The ECM switches on the 12 volt power and the ground, when required, just like a high voltage system, as we’ve seen before.
As with all these injectors, I always prefer to scope them with a current clamp. So in the next image, I have used the ‘Maths’ channel in the scope software to produce a differential voltage trace, with the addition of current.
Remember, the differential measurement can be made by sampling across the injector.
With these injectors, the current is limited by the ECM to a maximum value of approximately 20 amps. If the current rises above this value, the ECM is almost certainly at fault.
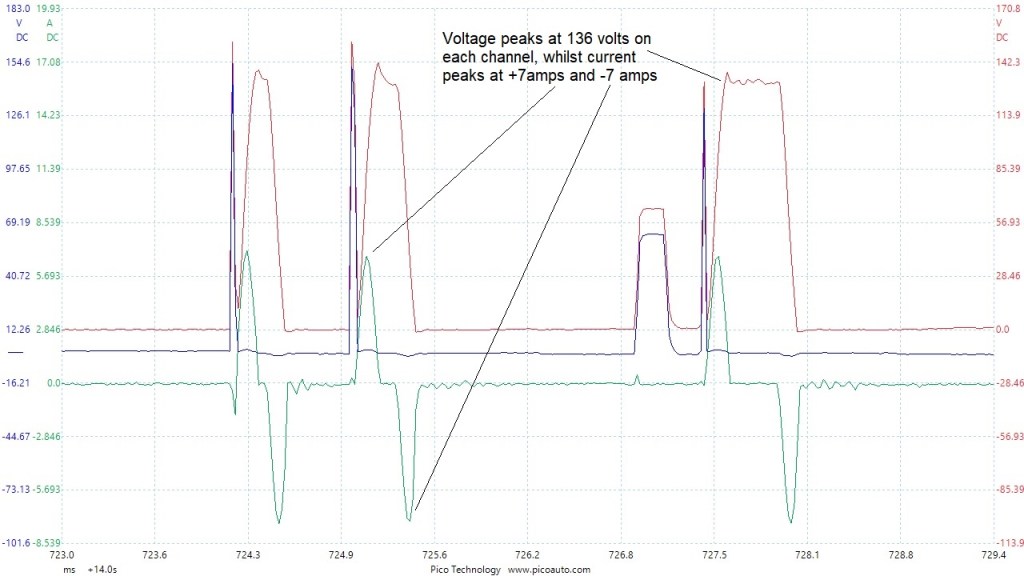
This next set of images, are taken from a Siemens-Continental Piezo injector system. The images come from the same vehicle at the same time. One of the injectors had a short circuit condition, as you will see.
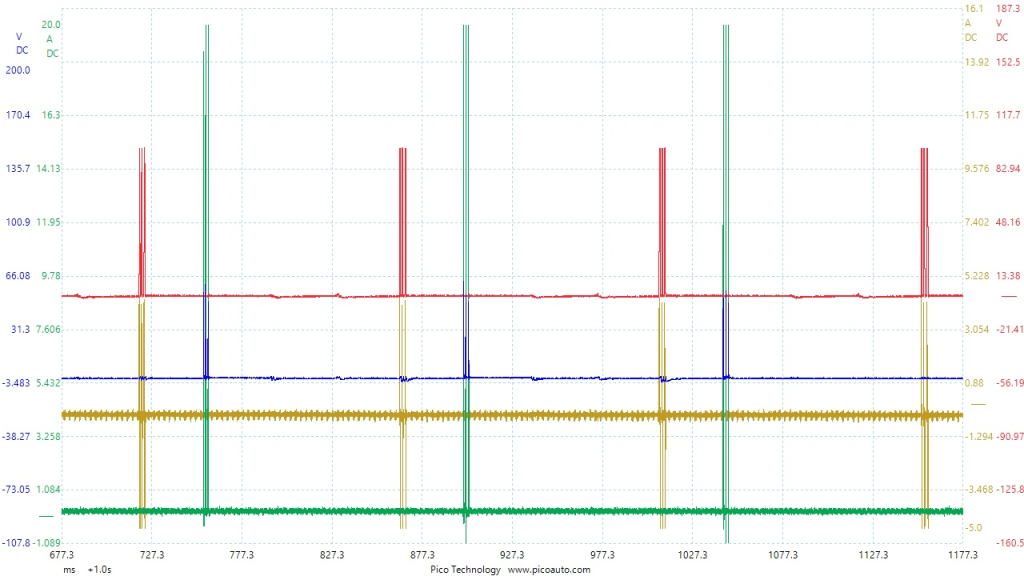
Blue trace – Voltage, bad injector
Red trace – Voltage, good injector
Green trace – Current, bad injector
Yellow trace – Current, good injector
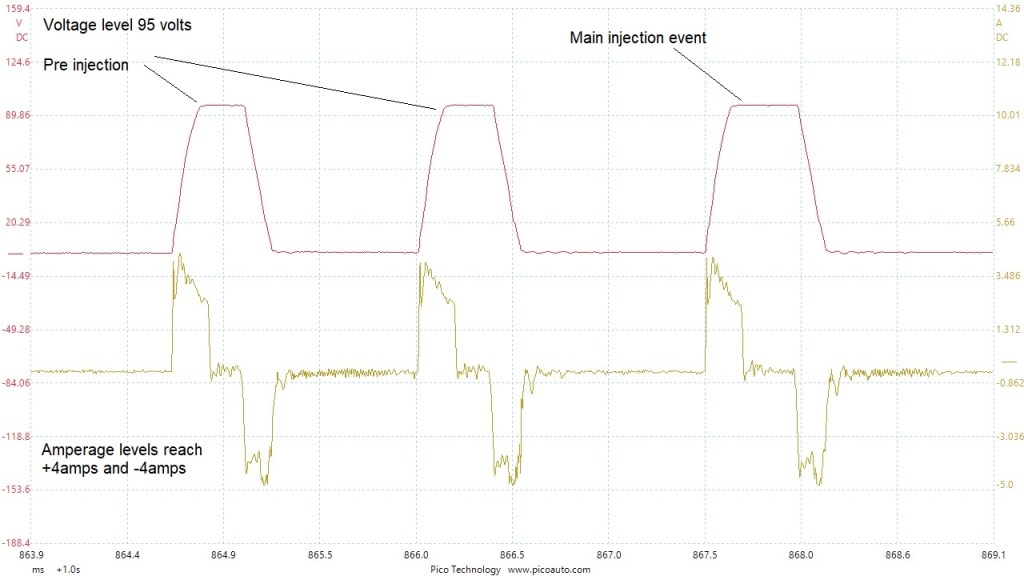
Piezo diesel injector detail, good. Two pre injection events, followed by a main injection event.
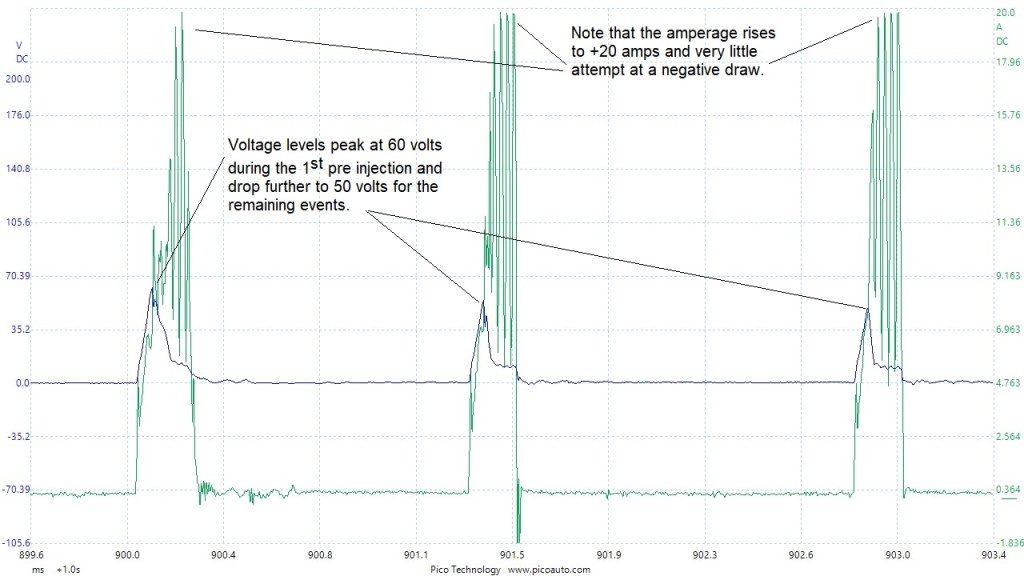
That was a good example, now for a bad. Take note of the current ramps and voltage peaks. This was a shorting piezo stack actuator, causing a misfire.
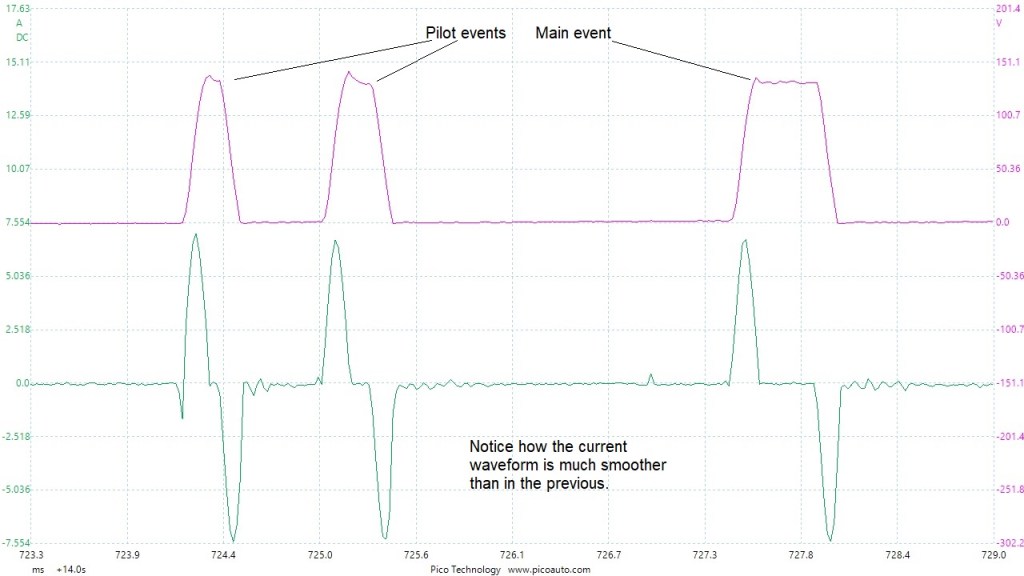
In this next couple of images, you will see slightly earlier version of Siemens Continental piezo injectors. You will notice how the current waveform is different to the previous.
This sample used both voltage channels using a common ground connection. In the following image I have cleaned up the voltage with a maths channel.
This next waveform is from a Bosch piezo injection system. The vehicle had a fault with the injector circuit, causing excessive current ramp, but I could not fault the injectors and I believe the fault was with the ECM current limiting circuit. The fault was no longer present after one of the injectors was disconnected, even after it was re-connected.
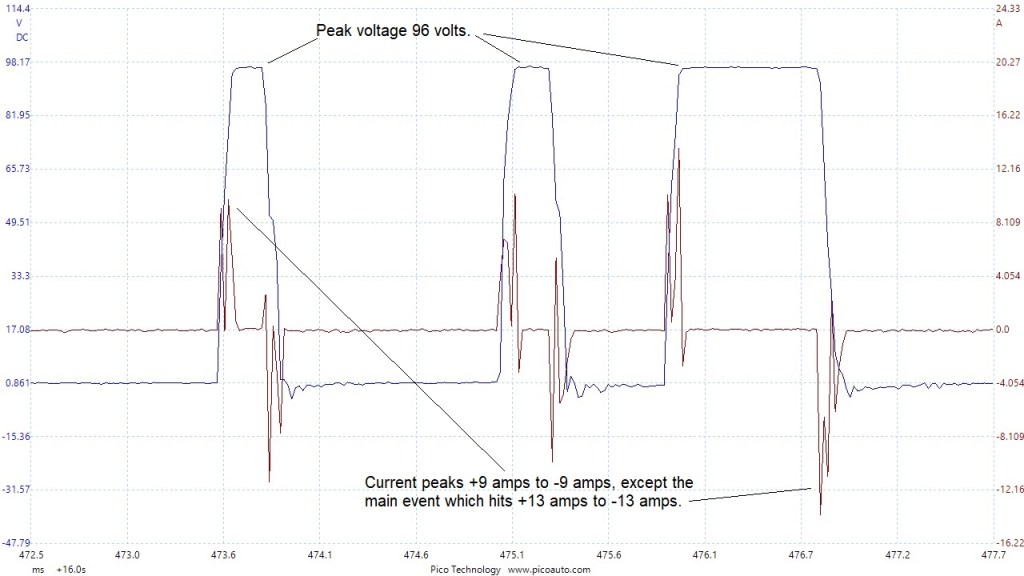
After the injectors were disturbed, this vehicle did not fail again. Sadly I didn’t record the bad captures, as I was going to set up a better capture of all the details and really did not expect the fault to go away. So when I connected the scope as above, the fault had rectified itself.
This next image shows an injection cycle, comprising two pilot events and a main event.
This is a Denso Piezo injector, with voltage captured across the injector, (differential connection), and current sampled with a low amp clamp.

This is a close up of the main injection event.
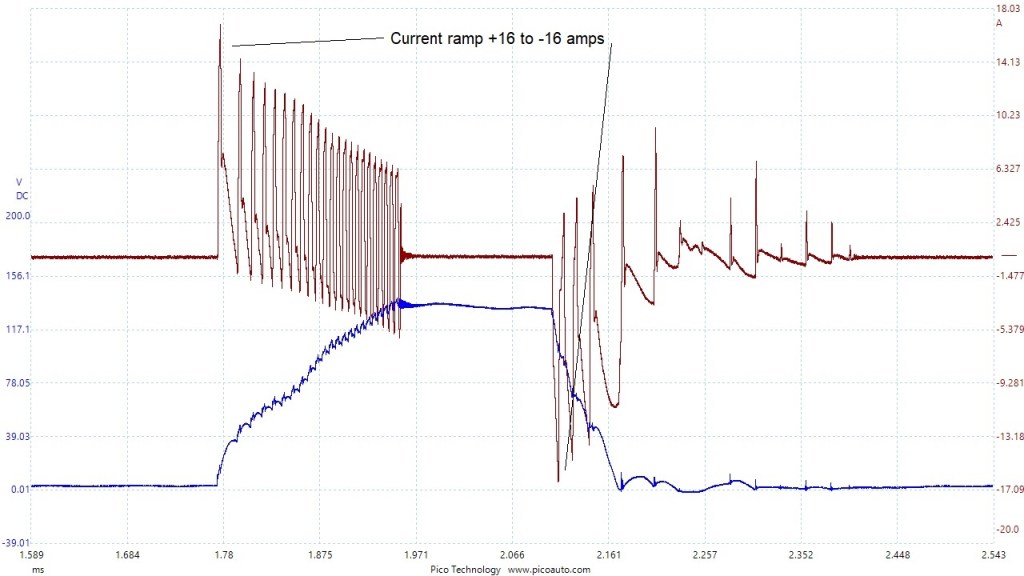
The main injection event only lasts 390 microseconds in this capture. These Piezo systems are really fast!
You will notice that with Piezo injectors, the voltage and the amperage may differ, dramatically, from one system to another and at differing load conditions. The Denso systems, seem to vary significantly. I have samples with voltages in excess of 160 volts and amperage in excess of +- 20 amps, whilst at idle with no load.
